Depression
How Depression Changes People's Vision
New research suggests depressed people process visual information differently.
Posted May 14, 2021 Reviewed by Devon Frye
Key points
- Major depression is associated with biological changes in the brain that influence various functions, including vision.
- According to new research, visual contrast suppression is reduced in depression.
- Though more research is needed, visual tests may one day provide a quick and simple way to detect depression.

Depressed people view the world differently—literally. Specifically, some research has found visual processing in depressed individuals to be abnormal. It is not clear if these visual abnormalities are related to retinal processing (i.e. how the eyes take in visual information) or cortical processing (i.e. how the brain interprets the visual information).
For an answer to the above question, I summarize a recent study (by Salmela and colleagues) published in the April issue of the Journal of Psychiatry and Neuroscience. The investigation’s findings suggest that patients with depression show a reduction in visual contrast suppression, but not brightness induction. This means the visual abnormalities in depression are likely related not to retinal processing but rather to cortical processing.
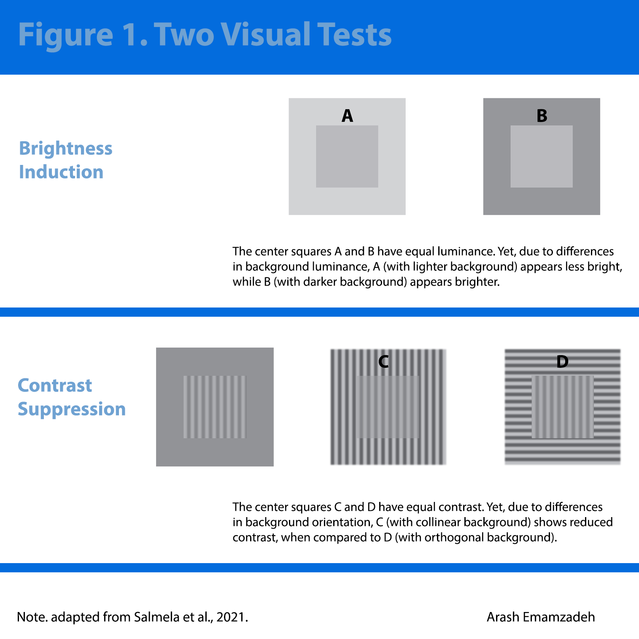
Below, I discuss the study further, beginning with a description of brightness induction and contrast suppression. Refer to Figure 1 as you read the sections below (Note: The visual illusions presented are not the exact ones used by Salmela et al.).

Brightness Induction
Brightness induction refers to how center brightness is affected by surrounding luminance. See the top visual illusions in Figure 1: The center patches are the same in A and B, yet the one in A appears dimmer and the one in B appears brighter. This occurs because of the effects of the surrounding brightness.
To test brightness induction in controls and clinically depressed patients, experimenters presented the participants with two center squares surrounded by backgrounds of higher or lower luminance; participants were instructed to select the brighter of the patches. For each image, the center and the background had either a small or large difference in luminance.
Contrast Suppression
The second test concerned contrast suppression, which refers to the effects of the surrounding on the apparent contrast of the visual pattern in the center. See bottom optical illusions in Figure 1: As you can see, unlike patches A and B, which had uniform luminance, patches C and D are of sine-wave modulation or gratings (i.e. alternating black-and-white bars). More importantly, though C and D have the same contrast, D appears to have a greater contrast than C. Why?
This optical illusion (the suppressed contrast in C) occurs because the lines in the center square C and its surrounding are collinear (i.e. share the same orientation). The lines in D and its background are orthogonal (i.e. at right angles to each other).
To test contrast suppression, experimenters presented two images to participants, who were asked to select the pattern with the greater contrast. The patches in these images had high-contrast backgrounds that were collinear or orthogonal. The contrast of the image itself was low. Note: Some patches were presented with no surrounding images.
Visual Processing in Major Depression: Sample and Measures
Before looking at the results, let us learn more about the study’s methods and those who participated in the above experiments.
Participants were 111 patients with depression—specifically, unipolar depression (46), bipolar depression (38), and borderline personality disorder with depression (27). The authors also recruited 29 demographically matched controls. A follow-up, where participants repeated the same measurements, was conducted seven months later; it had a sample of 74 patients.
Multiple measures were used—several structured clinical interviews, the Montgomery-Åsberg Depression Rating Scale [MADRS], the Beck Depression Inventory-II, the Alcohol Use Disorders Identification Test, etc.
As described in the previous section, two visual tests were conducted: brightness induction and contrast suppression. Both tests used an adaptive method, changing the difference between the images presented until reaching a point where the viewers could not differentiate the contrast or brightness of the patches.

Visual Processing in Major Depression: Results
Analysis of data showed no differences in the perception of brightness induction between controls and patients with depression—including patients with major depressive disorder, bipolar depression, or borderline personality disorder.
However, there was a significant reduction in contrast suppression in patients with depression (not controls).
In conclusion, major depression alters cortical processing of visual information but not retinal processing.
This conclusion follows from the fact that brightness induction is thought to involve retinal processing, while contrast suppression seems to involve cortical processing.
Specifically, as the authors note, contrast suppression in the visual cortex requires the interaction of “an excitatory feedforward signal (originating from the retina) and an inhibitory feedback signal (from higher cortical areas).” However, since no differences were found between depressed and non-depressed patients in the experiments that used brightness induction optical illusions, the reduction in contrast suppression in depression is not due to the signal from the retina but the inhibitory feedback from cortical areas.
Takeaway
The present investigation assessed visual perception in patients with depression by examining retinal brightness induction and cortical contrast suppression. It found only reduced contrast suppression in depressed patients, an effect potentially explained by abnormal cortical processing of visual information.
In terms of the applications of the present findings, one possibility is the future use of visual tests in detecting depression—of course, only after these tests have been developed further and fine-tuned.
If it sounds strange to imagine using a visual exam to detect depression, we need to remember major depressive disorder is a complex mental illness involving emotional symptoms (e.g., sad mood, anhedonia, and lack of motivation), vegetative symptoms (e.g., sleep, appetite, and weight changes), and cognitive symptoms (e.g., attention, concentration, and memory difficulties).
Furthermore, major depression involves changes in the levels of multiple neurotransmitters—e.g., serotonin, norepinephrine, dopamine, glutamate, GABA—and biological structures in the brain.
Therefore, there may be several ways to detect depression. And visual contrast tests could one day provide a simple and quick way to do so.
LinkedIn image: khuruzero/Shutterstock. Facebook image: Rynio Productions/Shutterstock.


