Education
Yes—We Are Divided, But It's Not Just Politics and Media
Don't forget real differences in education, poverty, punishment, and language.
Posted January 18, 2021

Since the days of John Snow’s cholera maps of 1850s London, epidemiologists have taken advantage of geographic tools to study the nature of illness and treat disease. Long ago, medical specialists recognized that a bird’s eye view of sickness can facilitate the discovery of viral transmission routes.
This information can be used to guide behavior designed to slow infection rates. For example, one can reduce the threat of Lyme disease, plague, and hantavirus by staying away from the Northeastern U.S., central Africa, and rural New Mexico, respectively.
In addition to disease, maps reveal important information about social divisions, character, and how we organize our lives. Here are four: education, poverty, punishment, and language.
1. Education: Gaps in Achievement
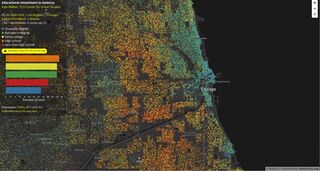
Demographic studies show how the neighborhood in which you were raised can dramatically alter future earnings, longevity, and educational outcomes—all of which are interconnected. The association between educational achievement and geography is striking. Each dot on the maps shown here represents between 25 and 500 people, depending on the level of zoom. The dots are color-coded based on five education categories (blue=graduate degree, green=bachelor’s degree, yellow=some college, orange=high school, red=less than high school). The colored bars on the left represent the proportional share of each category for the geographic area displayed on the screen.
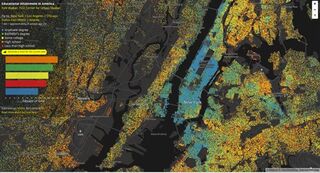
In each of these cities, residents of the inner hub are more likely to have graduate degrees. Income is positively related to education level, consistent with the affordability of those city spaces. These maps colorfully illustrate distinct clustering patterns of scholarly achievement that extend into the political and social realms. Similar maps on a national scale show an educational divide among rural and urban areas. Degree holders at bachelor’s and graduate levels tend to cluster in cities, as opposed to rural areas where education beyond high school is less common.
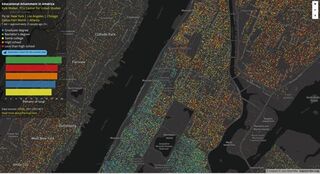
The maps of Chicago and New York are compelling because they highlight the variation within crowded urban areas. In some instances, the contrast between bordering neighborhoods is unmistakable, reflecting gaps in achievement related to racial and economic partitioning. Manhattan is almost entirely an island of degree holders with some blue areas extending into Brooklyn, Queens, and the New Jersey side across the Hudson River. The largely working-class neighborhood of East Harlem, dappled red and yellow on the map, provides a stark contrast to the rich blue of the Upper East Side.
2. Poverty: Food Insecurity and Longevity
Despite improvements in recent years, rates of “food insecurity,” defined by the United States Department of Agriculture as being “unable to acquire, at some time during the year, enough food to meet the needs of all their members because they had insufficient money or other resources for food,” remain higher than before 2007. Households meeting the criteria for food insecurity may need to make tradeoffs between housing, medical bills, or other vital essentials, and purchasing nutritionally suitable foods. The USDA estimates that 42 million Americans, including 13 million children, were food insecure in 2015.
According to Feeding America, the nation’s largest domestic hunger-relief organization dedicated to ending hunger through a network of 200 food banks and 60,000 food pantries, food insecurity varies by geographic region and metropolitan status as well. Since 2010, they have published annual maps that show the distribution of food insecurity across counties in the United States. Counties in the South have the highest mean rate (16.1%), compared to regional county averages in the West (13.7%), Midwest (12.1%), and Northeast (11.8%). Food insecurity is also disproportionately rural: 63% of all counties in the United States are rural, but account for 76% of the counties with food insecurity rates that rank in the top 10% of all counties.
From 2001 to 2014, the gap in life spans between the wealthy and poor in the United States widened. Analyses of income reveal that, among American men, the top one percent live 15 years longer compared to the poorest one percent; the gap is 10 years for women. This accelerated gain in longevity for the rich is not confined to certain regions of the country. It seems that everywhere in the United States the wealthiest are living longer. As a whole, the poorest had very little gain, with large disparities among different locations. Geography, from what these data suggest, matters more for the poor.
3. Discipline: Corporal Punishment for Children
Corporal punishment is the deliberate infliction of physical pain upon a student with intention of causing bodily pain as a means of discipline. According to the United States Department of Education, as of 2017, the District of Columbia and 27 other states prohibit corporal punishment. The remaining 23 states permit it or do not have specific restrictions.
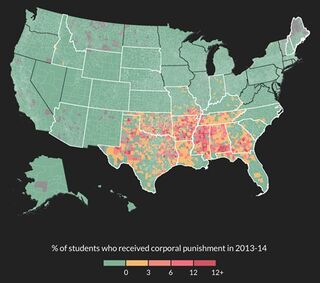
Despite evidence that corporal punishment may lead to alcohol abuse, mood disorders, anxiety disorders, personality disorders, and make a child more aggressive, defiant, oppositional, the practice remains widespread in the United States. Nationally, 110,000 students were subjected to corporal punishment in school during the 2013-2014 academic year, according to the U.S. Department of Education's Civil Rights Data Collection.
4. Linguistics: Variation in Regional Expressions
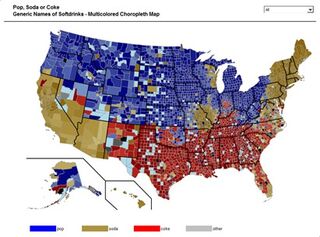
In the United States, preferences for generic names of soft drinks vary regionally. Individuals in New England and California prefer the term “soda.” The upper Midwest extending out to the Pacific Northwest favors “pop.” While southern states tend to say “Coke” when referring to the entire category of soft drinks that includes Sprite, Dr. Pepper, and Mountain Dew. The world headquarters for Coca-Cola is located in Atlanta. This might explain part of the preference that dominates the south. It is not unusual for servers in restaurants to ask, “What kind?” when a customer orders a Coke. An equally appropriate response might be, “I’ll have a Sprite.”
Twitter, the social media platform that allows users to type out messages with a maximum of 280 characters in most languages, is overflowing with personal, emotional, and behavioral content. Savvy analysts can then turn "tweet" data into revealing geographic displays. One linguistic analysis revealed that tweets originating from the upper mid-west (Ohio, Iowa, Minnesota) were more likely to contain the word “buddy” compared to tweets from other regions.
The term “dude” was popular in Michigan, Indiana, Ohio, and parts of the South and Southwest, including Louisiana, portions of Texas, New Mexico, Arizona, and Southern California. The region in central Texas extending roughly from Dallas to San Antonio preferred “bro” over “dude."
©2020 Kevin Bennett, Ph.D. All rights reserved.
References
Afifi, T. O., Mota, N. P., Dasiewicz, P., MacMillan, H. L., & Sareen, J. (2012). Physical punishment and mental disorders: Results from a nationally representative US sample. Pediatrics, 130(2), 184-192. doi:10.1542/peds.2011-2947
Bitensky, S. H. (2008). The poverty of precedent for school corporal punishment’s constitutionality under the Eighth Amendment. University of Cincinnati Law Review, 77, 1331.
Feeding America (2017). Overall food insecurity report 2017 (pp.1-43). Retrieved from map.feedingamerica.org
Mundigl , R. (2009, August 18). Choropleth Map Template USA by Counties. Retrieved February 04, 2018, from http://www.clearlyandsimply.com/clearly_and_simply/2009/08/choropleth-m…
Walker, Kyle E. (2016). Locating neighbourhood diversity in the American metropolis. Urban Studies.
Huang, Y., Guo, D., Kasakoff, A., & Grieve, J. (2016). Understanding U.S. regional linguistic variation with twitter data analysis. Computers, Environment and Urban Systems, 59, 244-255. 10.1016/j.compenvurbsys.2015.12.003


