President Donald Trump
What Do You Hear? Clinton, Trump, and Their Predecessors
Are Clinton, and Trump in particular, rhetorical outliers?
Posted August 21, 2016

What do you hear?
Does a 1% decrease in the unemployment rate mean a president’s economic policies are working or not?
Does a call for “law and order” mean a politician wants to make streets safer or pursue racist policies?
A cable news talking head recently said that Trump’s acceptance speech conjured up a “relentlessly dark” “Mad Max America” that “terrified” him. I suspect many people did hear that, while I also suspect many people didn’t.
Let's take an objective look at the issue of how much of an outlier Trump is.
- - - - - - - - - TRUMP & CLINTON: IN THEIR OWN WORDS - - - - - - - - -
Beyond Knee-Jerk Partisanship? Clinton, Trump, and Speeches
Comparing Morality: Clinton and Trump Tweets Head to Head
Is Trump a Tyrant? What His Tweets Say
- - - - - - - - - - - - - - - - - - - - - - - - - - - - - - - - - - - - - - - - - - - - - - - - - - - -
This post presents analyses of Trump’s and Clinton’s rhetoric on morality and their negativity, but adds all Democratic and Republican Party presidential nominees as well as some cool analyses on how similar they are to all presidential nominees individually.
Moral Foundations Theory (MFT) indicates morality has five dimensions that are found in almost all societies. And researchers have found that political liberals and conservatives emphasize different dimensions: liberals on care/harm and fairness/cheating and conservatives on loyalty/betrayal, authority/subversion, and sanctity/degradation.
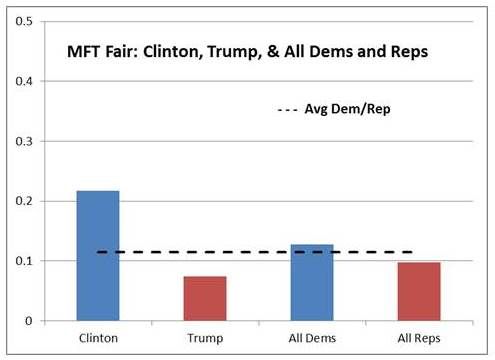
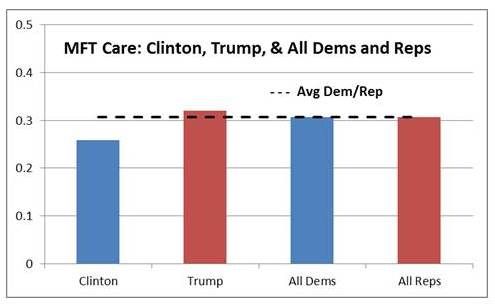
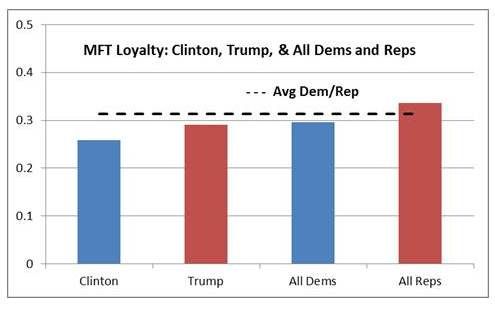
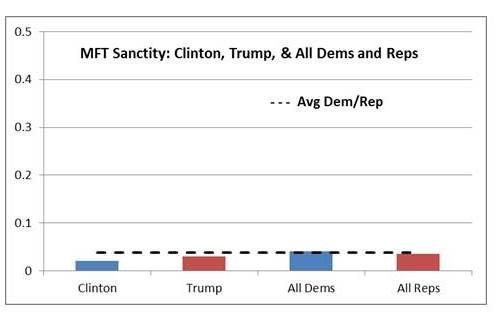
The following charts compare Clinton’s (blue bars) and Trump’s (red bars) nomination acceptance speeches to each other and to all Democratic presidential nominees (blue bars) and all Republican presidential nominees (red bars)* in terms of the five dimensions of MFT.
The first chart shows the Fairness dimension and that Democrats (13%) talk about it a bit more than Republicans (10%) and that Clinton (22%) mentioned it even more than the typical Democratic (13%) nominee. Trump (7%) mentioned it less, but not by a lot.
The next chart shows Clinton (26%) mentioned Caring a bit less and Trump (32%) a bit more than the typical Democratic (31%) and Republican (31%) nominee.
In terms of authority, Trump (29%) does stand out according to the next chart, but not all readers will agree whether the difference from Clinton (25%) and all Dems and Reps (23%) is consequential.

Republicans (34%) talk about loyalty more often than Democrats (30%), Trump (29%), and Clinton (26%).
And finally, politicians don’t seem to reference the sanctity dimension much according the chart. Democrats (4%) reference it the most.
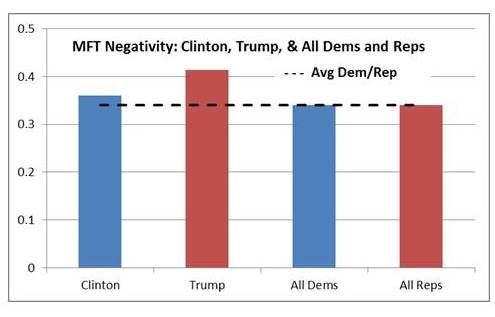
Now it was a cable news talking head’s comment that got me interested in this issue. So the next chart compares Trump’s speech to Clinton’s and all other nominees in terms of negativity. Trump (41%) was more negative than Clinton (36%), but Clinton was more negative than all Democrats (34%) and Republicans (34%). Big differences?
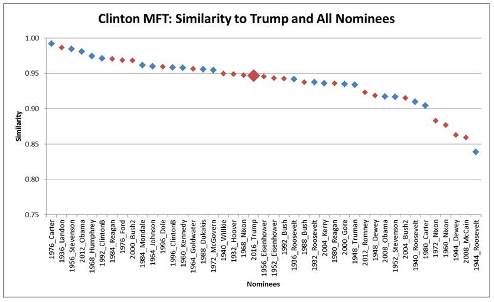
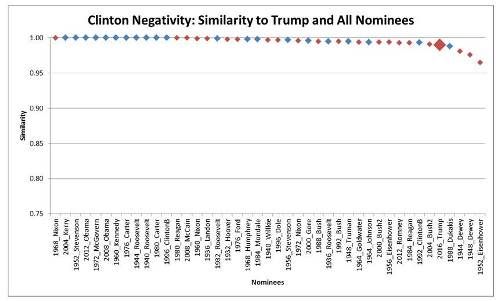
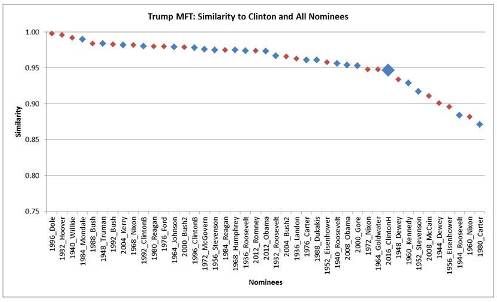
Here are the “cool” new analyses. Similarity is another interesting way to look at differences. How similar are Clinton and Trump to each other and their predecessors? The next charts show how similar they are to each other and to individual Democratic (blue diamonds) and Republican (red diamonds) nominees.
The first chart shows that in terms of MFT Clinton is most similar to Jimmy Carter (.99) and least similar to Franklin Roosevelt (.84). Her similarity to Trump (.95, represented by the over-sized red diamond) falls about in the middle of the pack of nominees. It’s important to note that the similarity measure ranges from -1 to 1, so Clinton is extraordinarily similar to her predecessors and Trump.
Clinton was most similar to Nixon 1968 (1.0, the maximum possible similarity score) and least similar to Eisenhower 1952 (.97) in terms of Negativity. She’s relatively distinct from Trump in regard to all the nominees, but still extraordinarily similar (.99) to him.
Here are the same charts for Trump. Like Clinton, he’s extraordinarily similar to his predecessors and, for that matter, his competitor (.95 for MFT and .99 for Negativity, represented by the over-sized blue diamonds).
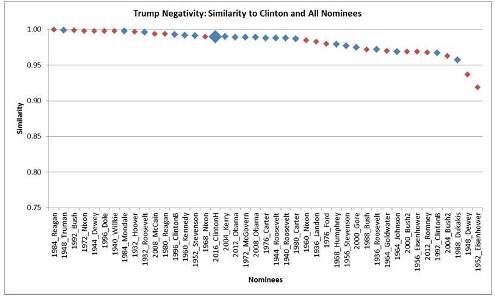
I hear what some of the talking heads say they hear the candidates say, Trump in particular, but I’m not convinced an objective look at the data says the same thing.
What do you hear?
- - - - - For more Moral Foundations Theory at “Caveman Politics” - - - - - - - - -
"Beyond Knee-Jerk Partisanship? Clinton, Trump, and Speeches"
“Comparing Morality: Clinton and Trump Tweets Head to Head”
“Is Trump a Tyrant? What His Tweets Say”
"Which of the 5 Types of Political Moralizer are You?"
"Could Disgust Make You an Environmentalist?"
"Are You Easily Disgusted? You May Be a Conservative"
- - - - - - - - - - - - - - - - - - - - - - - - - - - - - - - - - - - - - - - - - - - - - - - - - - - - - - - - -
* Includes nominees since 1932, the beginning of the “modern presidency” and FDR’s New Deal Coalition.


