Autism
Scans Reveal Diametric Differences in More Detail
Autism and schizophrenia are opposite in some brain areas, similar in others.
Posted April 27, 2017
In the post to which this is a followup, Serge Mitelman and his colleagues demonstrated (to quote the title of their paper) the diametrical relationship between gray and white matter volumes in autism spectrum disorder (ASD) and schizophrenia. Now the same authors have published a follow up study of cerebral glucose metabolism in ASD and schizophrenia.
Brain scans were obtained from 41 subjects diagnosed with schizophrenia, 25 with ASD, and 55 healthy control subjects:
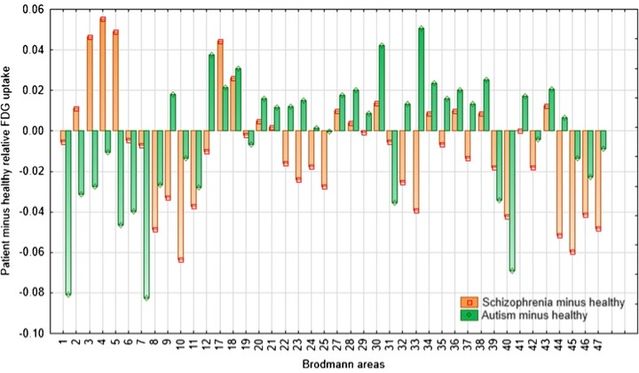
The main findings of this study, as pertains to direct comparison of subjects with schizophrenia and ASD, are twofold: 1) both groups displayed comparable deviations from the normal metabolic patterns in most of the regions generally associated with the so-called social brain; 2) divergent metabolic patterns, that are compatible with the hypothesis of ASD and schizophrenia as diametrical trade-off diseases, were confined to a much more limited assortment of structures, of which only the anterior cingulate, somatosensory and motor regions are tentatively accorded roles in social cognition (below).
Relative fluorodeoxyglucose uptake in subjects with schizophrenia, subjects with ASD and healthy controls. This graph is based onthe diagnostic group by-Brodmann area interaction in ANOVA with three diagnostic groups and 42 Brodmann areas. Orange and green bars represent metabolic rates in healthy controls subtracted from metabolic rates in subjects with autism and schizophrenia respectively, so that each patient group is plotted against the zero axis line of healthy controls.Source: Mitelman, S.A., Bralet, MC., Mehmet Haznedar, M. et al. Brain Imaging and Behavior (2017).


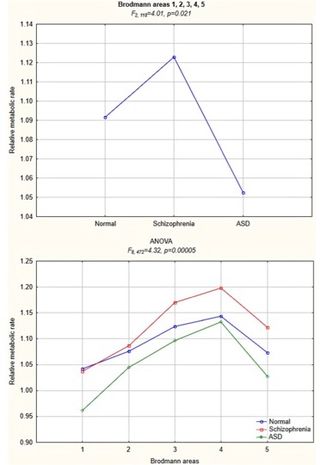
Specifically, “Diametrically different changes in subjects with schizophrenia and ASD were found in the pericentral somatosensory and motor cortex (areas 2, 3, 4, 5), anterior cingulate (areas 32, 33), frontal area 9, and hypothalamus. The overall pattern revealed (left), with schizophrenics above and autistics below normal, is exactly what the diametric model predicts. However, the authors report that "Schizophrenia and ASD appear to be associated with a similar pattern of metabolic abnormalities in the social brain. Divergent maladaptive trade-offs, as postulated by the diametrical hypothesis of their evolutionary relationship, may involve a more circumscribed set of anterior cingulate, motor and somatosensory regions and the specific cognitive functions they subserve."
Consider a parallel case: what you might call the “visual brain”—the cortex devoted to processing visual images in the occipital lobe, at the back of the head. Clearly, deficits in visual perception could be caused both by over-sensitivity of the retina of the eye and by under-sensitivity. In both cases, changes in the visual cortex could doubtless be detected by studies such as this, and in some circumstances might be quite similar: the result certainly would be, namely deficits in visual acuity. But the causes would be diametrically opposite: excessive sensitivity of the eye in one case, but deficient sensitivity in the other.
According to the diametric model of mental illness, much the same is true of the so-called social brain: deficits in measurable parameters of mentalistic skills, just like deficits in visual performance, might both be detectable in the brain, and demonstrable in tests of performance. But the causes would be diametrically different: deficits in mentalism in the case of ASD and excessive mentalism—hyper-mentalism—in psychotic spectrum disorders such as schizophrenia.
Exactly how this relates to the brain areas specified in this study remains to be seen, but the general finding that some regions reveal diametrically opposite patterns but that others do not is exactly what you would expect if you see ASD and schizophrenia as opposite in their fundamental causes, if not always in their manifest outcomes.
In any event, the true test of the imprinted brain theory lies in matching its predictions about conflicting gene expression in the brain with areas of opposed brain function. Here the finding regarding the hypothalamus is exactly what I would have expected, given the predominantly paternal pattern of gene expression found there in the mouse and the evidence of its role in ASD. But only when we know the exact regions where imprinted genes (and X chromosome ones which resemble them) are expressed in the human brain will we be able to look to brain imaging to confirm or refute the theory in detail.
(With thanks to Serge Mitelman for his help.)


