Media
Screen Time Is Out of Control
Teens and Millennials can’t keep their hands off their smartphones.
Posted February 8, 2023 Reviewed by Hara Estroff Marano
Key points
- Daily smartphone screen use is skyrocketing among Gen Z teens and young adults.
- The most common smartphone use is for connecting with others.
- Pilot studies using strategies to reduce smartphone use did not produce significant changes.
In 2021, I gave a talk to the American Academy of Child and Adolescent Psychiatry about work that we had done in our lab spanning the years from 2013 to 2020. As I had just retired, I had planned to write up the results and submit the paper to a journal for review and publication. Ah, the best intentions—and now it is 2023 and I still have not even begun the process. Honestly, I don’t think that I will ever get around to writing up the results formally. As a compromise, I am presenting the PowerPoint slides from my talk, with annotation.
NOTE: THE STUDIES AND RESULTS SHOWN IN THIS POST HAVE NOT BEEN PEER-REVIEWED, AS IS REQUIRED FOR A JOURNAL PUBLICATION.
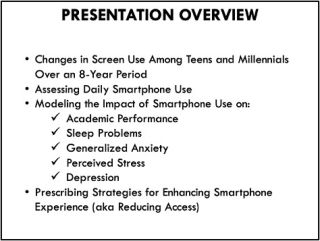
The talk examined three major studies/analyses: (1) screen use and attitudes toward technology among teens and Millennials using the same measurement tool over eight studies; (2) using data from individual studies to model the impact of smartphone use on a variety of variables including academic performance, sleep problems, and three psychological variables; and (3) the impact of strategies for reducing smartphone access.
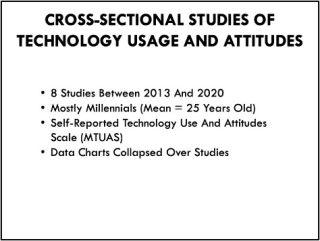
Eight studies examined self-reported technology use and attitudes among Millennials using the Media and Technology Usage and Attitudes Scale (MTUAS; Rosen, Whaling, Carrier, Cheever, & Rokkum, 2013). The MTUAS is an instrument created and validated by our lab and used extensively by other researchers around the world (currently 700 citations in Google Scholar). This scale asks questions about how often study participants “check in” with technologies such as smartphones, video games, and social media sites. In addition, questions concern attitudes toward technology on a Likert scale from "strongly disagree" to "strongly agree". For example, one item asks agreement or disagreement to the statement, “I am anxious when I am not able to use my smartphone.”
While each study examined different target variables, all used the MTUAS. The data were collected from eight studies, all with Millennials, who were statistically similar enough to collapse over studies. Average age varied from 22.47 to 24.45. The sample sizes ranged from 343 to 944. The combined sample was 38% male and 63% Hispanic and Spanish descent.
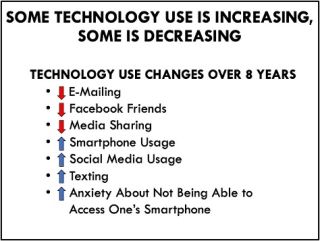
Statistically, across eight years, Millennials demonstrated significant decreases in emailing, Facebook friends, and media sharing. In contrast, Millennials showed increases in smartphone usage, social media usage, texting, and anxiety about not being about to access one’s smartphone. These changes are important in viewing trends in technology usage and indicate that Millennials were moving away from “old” tech and toward new screen uses. in addition, the study also shows that anxiety about smartphone usage increased over the eight years.
This is concerning and concurs with the data from the National Institute of Mental Health showing that 31.9% of adolescents had an anxiety disorder (https://www.nimh.nih.gov/health/statistics/any-anxiety-disorder)
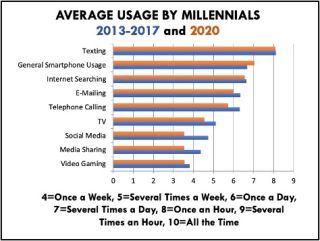
The next slide shows average Millennial usage of nine of the items on the MTUAS (partial MTUAS scale is at the bottom of the slide). The blue lines reflect usage from 2013 to 2017 combined, while the orange lines show the data from 2020. Texting and smartphone use were the most common technologies used by Millennials, followed by internet searching, emailing, and telephone calling. Interestingly, social media usage was averaging only about once a week. Given that the social media score computed the average usage (frequency of checking in) of 11 social media sites, that is not surprising, as Millennials most often have their preferred social media site and actively use several others at least once a week while not using others at all.
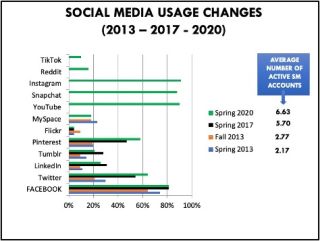
This slide shows usage of the various social media sites from 2013 to 2020 where the average number of "active" social media sites (at least once a week) rose from two to seven in just eight years. In 2020 the most popular sites were Instagram, Snapchat, YouTube, and Facebook.
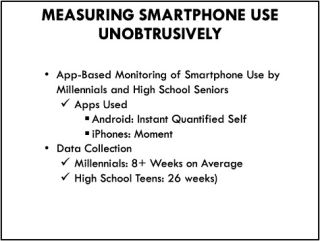
This slide depicts a series of studies from 2016 to 2020 in which participants installed an app that monitored daily smartphone use, counting number of times they “unlocked” their phone per day and the amount of time the phone was open during the day. The studies included both Millennials and teens.
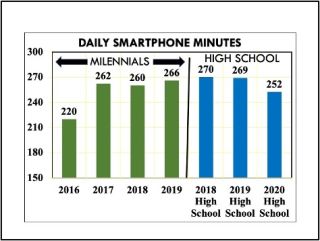
This slide shows the daily smartphone minutes for Millennials between 2016 and 2019 as well as the data from high school seniors from 2018 to 2020. For Millennials, there appeared to be a large shift from spending more time on the phone, from about 220 minutes per day to about 260 minutes a day. High school seniors logged the same roughly 270 minutes across the three years from 2018 to 2020.
NOTE: The apps used to monitor daily smartphone minutes and unlocks had some issues— particularly the iPhone app—where data were clearly wrong and showed numbers that were not realistic. Using specific cutoffs, those “iffy” data were removed. Despite those irregularities in the absolute data, the relative data trends should be seen as accurate.
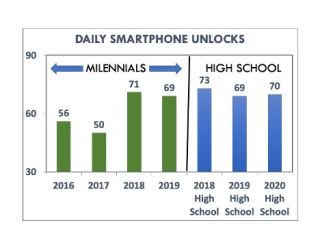
This slide shows the daily smartphone unlocks for Millennials between 2016 and 2019 as well as the data from high school seniors from 2018 to 2020. For Millennials, there appeared to be a large shift in opening the phone, from about 50 times a day to about 70 times a day. High school seniors logged the same 70 unlocks across the three years from 2018 to 2020. If you assume eight hours of sleep, that leaves 16 hours for 70 unlocks each day. Divide 70 unlocks by 16 hours per day and you get 4.4 unlocks per hour, or one unlock approximately every 15 minutes.
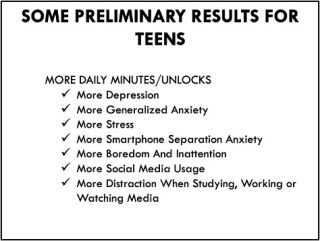
This slide shows the result of one study with teens in which the daily smartphone minutes and unlocks were correlated with other target variables indicating that more unlocks and minutes were related to decreased psychological state, more social media use, and more distractibility.

This slide depicts a study of millennials in which participants were asked to take screenshots of their weekly Screen Time data on iPhones or Digital Well-Being data on Android phones (for course extra credit). Both provided a wealth of daily smartphone data.
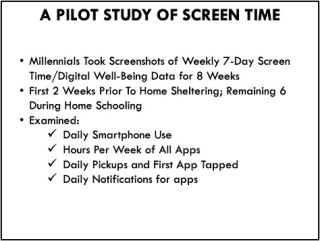
The study took place just prior to pandemic home sheltering, so the first two weeks reflected normal campus course attendance while the last six weeks reflected off-campus course attendance.
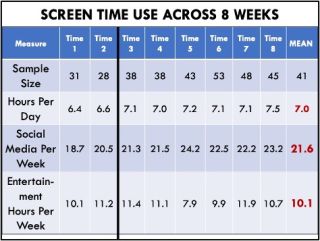
This slide depicts the data across the eight optional weeks to submit screenshots. As is evident, the sample sizes varied from 28 to 53, with more students providing data during the last three weeks (obviously realizing that they needed that extra credit!). The dark vertical line separates the pre-pandemic in-person course time and the pandemic online course time.
Hours per day show an increase from the 270 minutes (4.5 hours per day) in the earlier study to seven hours per day in this study. Quite frankly, I don’t think that this depicts a major change but rather a change from a study using somewhat “iffy” apps.
The data also indicate that social media apps engage users for roughly three hours per day, followed by entertainment apps that account for about an hour and a half a day.
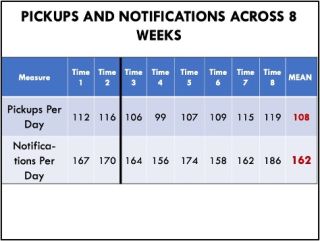
The next slide shows that Millennials are picking up (unlocking) their phones more than 100 times a day, which is about every 17 minutes, or four times per hour. Strikingly, Millennials demonstrated that they received more than 150 notifications a day, meaning that their phone buzzed, beeped, or played a tune once every 2.5 minutes!
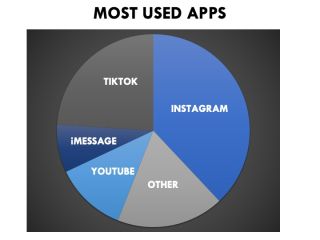
Screen Time and Digital Well-Being provide a wealth of information. This pie chart shows that the most-used apps, in terms of minutes per day, are nearly all “connection” apps whereby the user connects with others.
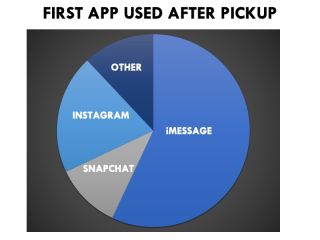
The next pie chart shows the same trend when considering where the user taps after unlocking the phone. iMessage is most often the first app to be opened, as also seen in the third pie chart,
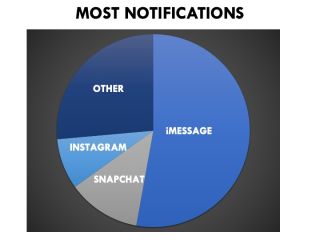
it is responsible for more than half of the notifications.
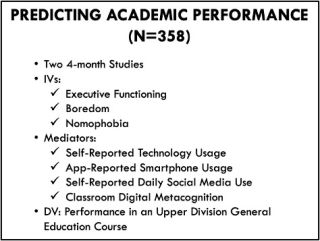
Two of the studies examined a mediated model to predict academic performance in an upper-division general education course. Three variables were considered as possible independent psychological variables while four technology-related variables were considered as mediators.
The model shows that both executive function (or, rather, dysfunction) and nomophobia (anxiety about not being able to use smartphone, access the internet) directly predicted the participant’s grade in the course. The more the participant had reduced executive functions and the more nomophobia, the lower the course grade.
Boredom was a mediated predictor of course grade in two ways. Participants who were more bored in general used more daily social media, which predicted a lower course grade. In addition, those who were more bored in general had worse “classroom digital metacognition”— essentially knowing what to do with technology during class—had worse course grades.
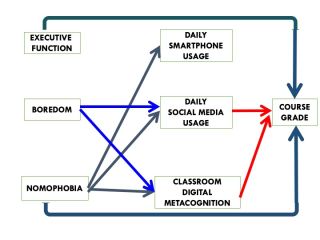
Additionally, it is important to note that those participants with more nomophobia also had worse classroom digital metacognition, which predicted a lower course grade. Higher nomophobia also predicted more smartphone use and more social media use but neither of those served as a mediator.
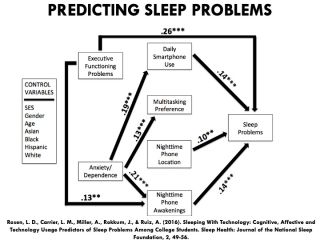
In a study published in the Journal of the National Sleep Foundation, we tested a mediated model predicting sleep problems. As in the model predicting academic performance in the last slide, executive functioning problems directly predicted sleep problems. Participants who made poorer nighttime decisions (e.g., using screens immediately prior to bedtime, placing the phone within arm’s length during sleep, and leaving the phone on ring or vibrate) had more sleep problems.
Anxiety/Dependence (this is the same variable as nomophobia in the previous slide) showed mediated effects on sleep problems. it predicted more daily smartphone use, which, in turn, predicted sleep problems. Nomophobia also predicted more nighttime phone awakenings, which, in turn, predicted more sleep problems. Interestingly, nighttime phone location (close at hand or far away) predicted more sleep problems by itself without either of the independent variables impacting phone location.
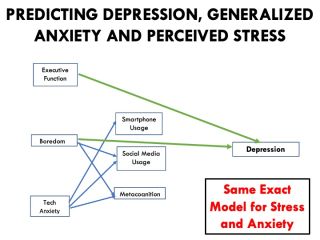
This study used the same three predictors—executive functioning, boredom, and nomophobia—to predict depression, stress, and generalized anxiety. Again, executive function acted as an independent predictor of all three dependent variables. Interestingly, however, boredom was also an independent predictor. Even though both boredom and nomophobia were linked to the three mediators, none of the mediators then predicted the dependent variables.
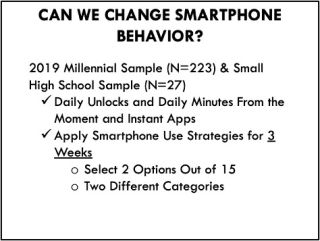
Prior to the pandemic, we were interested in seeing whether we could reduce smartphone use through the application of prescribed strategies. Two samples—Millennials and teens—examined a list of 15 potential strategies
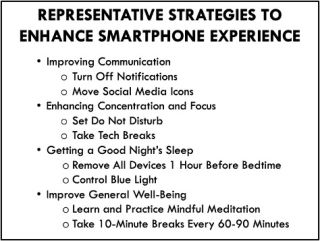
and opted for two from two different categories (see examples on the next slide). While using the same two tracking apps that had been used in earlier studies, a three-week baseline was established. Participants then applied their selected strategies for three weeks. An additional three weeks of data were collected to determine any post-intervention effects.
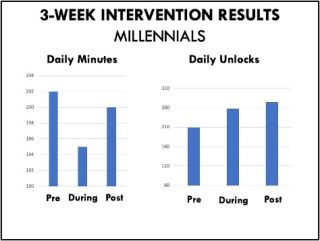
Millennials did show a decrease in daily minutes using their smartphone (albeit only a mean of seven minutes) but did not show the same for daily unlocks. In fact, the number of daily unlocks actually increased. However, the post-intervention assessment demonstrated that whatever reduction they had in daily minutes during the three-week intervention all but disappeared by the post-intervention assessment.
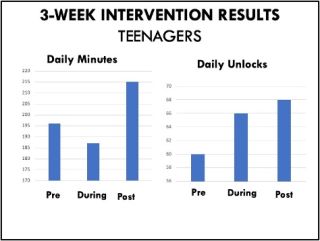
The data for teens looked like that of Millennials. Daily smartphone minutes did decrease, albeit only a few minutes, during intervention. However, following the intervention, the minutes increased to a level higher than during baseline. In addition, daily unlocks did not show a decrease during the intervention, but rather, showed an increase that continued to increase following the intervention. NOTE: This teenage sample (N=27) is likely too small from which to derive any true causal conclusions.
Perhaps, to compensate for spending less time on their smartphones during the intervention, both the Millennials and teenagers opted to check in more often by unlocking their phones more often during the intervention. However, that doesn’t explain why both showed continued increases beyond the intervention.
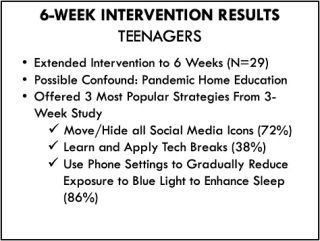
One possibility for the fact that the results of the three-week study produced only very minimal changes in daily smartphone minutes and no change in unlocks might be that there were too many intervention choices, and the intervention was too short to demonstrate impacts. In this small pilot study of teenagers, we offered only the three strategies from the three-week study that were the most often selected strategies: moving and hiding all social media icons, using tech breaks, and changing phone settings to enhance sleep.
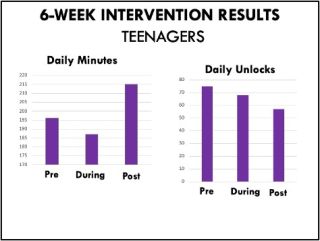
Although this pilot study had a small sample, it appears that there was a drop in daily smartphone minutes (again, very small) and then a dramatic increase following the six-week intervention. Interestingly, daily unlocks appeared to decrease during the intervention but then continued to drop post-intervention. Again, this is a small sample and none of the changes were statistically significant.
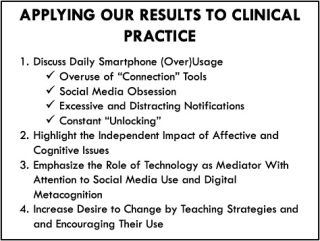
Since this was a talk to psychiatrists who specialized in working with children and adolescents, I added some applications for them to potentially use with their patients. The first, and most salient suggestion is to highlight the excessive overuse of the smartphone by examining the patient’s weekly usage using the Screen Time or Well-Being apps as fodder for discussion of the time spent using the smartphone as well as the large number of unlocks, notifications, etc. In addition, therapists can focus on both the total daily time using the smartphone as well as the time spent on specific apps such as social media.
The second suggestion is to note that the models predicting poor academic performance, sleep problems, and psychological issues are consistently directly predicted by affective variables (nomophobia) as well as cognitive issues such as executive dysfunction and boredom.
The third suggestion involves discussing the role of various technology uses including social media and classroom digital metacognition. In many of the models, these were mediators, increasing the impact of nomophobia and executive dysfunction.
Finally, the fourth suggestion is to apply some of the strategies from the two studies to classroom experience. For example, to increase classroom attention and focus (or even home focus) one might try teaching tech breaks. For example, in, say, a one-hour class, the teacher might provide a tech break for maybe a minute or two during the class to allow the students to dissipate the anxiety building up due to nomophobia.
If a patient appears to be obsessed with social media, it might be helpful to have them move the icons elsewhere from the front page or even put a time limit on their use. If the patient is having difficulty sleeping, the psychiatrist might work with the Night Shift (iPhone) or Night Mode (Android) apps. In addition, working with parents to set limits about nighttime use would also be helpful.
References
Bradley, A. H., & Howard, A. L. (2023). Stress and Mood Associations With Smartphone Use in University Students: A 12-Week Longitudinal Study. Clinical Psychological Science, 21677026221116889.
Weinstein AM (2023) Problematic Social Networking Site use-effects on mental health and the brain. Front. Psychiatry 13:1106004. doi: 10.3389/fpsyt.2022.1106004.
Rosen, L.D., Whaling, K., Carrier, L.M., Cheever, N.A., and Rokkum, J. (2013). The Media and Technology Usage and Attitudes Scale: An empirical investigation. Computers in Human Behavior, 29(6), 2501-2511.
Gazzaley, A. & Rosen, L. D. (2016). The Distracted Mind: Ancient Brains Living in a High-Tech World. MIT Press.
Rosen, L.D., Cheever, N. A., & Carrier, L.M. (2012). iDisorder: Understanding Our Obsession With Technology and Overcoming its Hold on Us. New Your, NY: Palgrave Macmillan.
Cheever, N. A., Rosen, L. D., Jimenez, M., Franco, J., and Carrier, L. M. (2021). Nomophobia Impacts Physiological Arousal of Moderate and Heavy Smartphone Users Who are not Allowed to Access Text Messages during a Cognitive Task. International Journal of Humanities and Social Sciences, 11(7), 6-13.
Rosen, L. D., Carrier, L. M., Pedroza, J. A., Elias, S., O’Brien, K. M., Lozano, J., Kim, K., Cheever, N. A., Bentley, J., & Ruiz, A. (2018). The Role of Executive Function and Technological Anxiety (FOMO) in College Course Performance as Mediated by Technology Usage and Multitasking Habits, Revista Psicologia Educativa (The Spanish Journal of Educational Psychology), 24(1), 14-25
Uncapher, M. R., Lin, L., Rosen, L. D., Kirkorian, H. L., Baron, N. S., Bailey, K., … & Wagner, A. D. (2017). Media multitasking and cognitive, psychological, neural, and learning differences. Pediatrics, 140(Supplement 2), S62-S66.
Rosen, L. D., Carrier, L. M., Miller, A., Rokkum, J., & Ruiz, A. (2016). Sleeping With Technology: Cognitive, Affective and Technology Usage Predictors of Sleep Problems Among College Students. Sleep Health: Journal of the National Sleep Foundation, 2, 49-56.
Cheever, N.A., Rosen, L.D., Carrier, L.M., & Chavez, A. (2014). Out of sight is not out of mind: The impact of restricting wireless mobile device use on anxiety levels among low, moderate and high users. Computers in Human Behavior, 37, 290-297.
Rosen, L.D., Carrier, L.M., & Cheever, N.A. (2013). Facebook and texting made me do it: Media-induced task-switching while studying. Computers in Human Behavior, 29(3), 948-958.
Rosen, L.D., Whaling, K., Rab, S., Carrier, L.M., & Cheever, N.A. (2013). Is Facebook Creating “iDisorders”? The Link Between Clinical Symptoms of Psychiatric Disorders and Technology Use, Attitudes and Anxiety. Computers in Human Behavior 29, 1243-1254.


